No edit summary Tag: 2017 source edit |
No edit summary Tag: 2017 source edit |
||
| Line 258: | Line 258: | ||
* '''Show diagram:''' Switches back to the diagram after viewing the raw XML. | * '''Show diagram:''' Switches back to the diagram after viewing the raw XML. | ||
{{translation}} | |||
Revision as of 07:13, 8 April 2025
Business Process Model and Notation (BPMN) is a graphical representation for specifying business processes. BlueSpice provides an intuitive GUI (graphical user interface) for creating BPMN diagrams. The feature is based on the open source project bpmn.io. The extension Page Forms is used to facilitate the input of information for each element.
How to start
To get to the BPMN editor, you can choose between 3 options:
- The Entrypoint Processes in the main navigation. Note that administrators can deactivate this link in the configuration manager. On the Processes page, you can click the link New Process in the page tools panel.
- The link Processes in the Overview section of the Global actions menu.
- The menu item New process of the plus-icon button in the header bar.
Select one of these links to open the BPMN editor.
Creating a diagram
To create the diagram:
- Enter a process name.
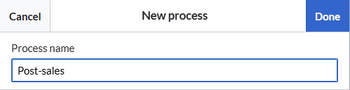
New process dialog. - Click Done. The BPMN editor opens. At this point, the diagram contains a start event. You cannot save the diagram until the diagram meets the minimum requirements for saving.

Before continuing with the diagram, let's look at the functionality of the BPMN editor.
Features of the editor
The editor includes the following elements:

| Element | Functionality | Description |
|---|---|---|
| 1 | Cancel | Leaves the edit mode without saving any changes. |
| 2 | Center diagram | Centers the diagram on the page in view mode. |
| 3 | Save changes | Saves the diagram and any wiki pages that need to be created. |
| 4 | Toolbar | Contains all commands for editing a diagram. |
| 5 | Start event | The start event is already added to the diagram. You still need to add the required label. |
| 6 | Toggle linting overlays | Shows errors and warnings. You need to click this button if your diagram cannot be saved. |
| 7 | bpmn.io info | Link to the bpmn.io website. Unless you are interested in the technical background of the editor, you can ignore this button. |
Adding the diagram shapes
Each diagram needs a start event and an end event. There are many additional useful elements to create a meaningful business process diagram.
The main elements of a BPMN diagram are:
- events (such as the start or end event),
- activities (mainly different types of tasks), and
- gateways (decision points between different paths).
If you are not familiar with BPMN, you can refer to the Camunda BPMN 2.0 Symbol Reference.
The most basic diagram you can save has a start event with a label and a connected end event with a label.

To add a shape, click the predecessor shape. Select a symbol to append the next shape.

Each shape requires a label. If you enter the same label twice, the system automatically converts the label to show a unique name.
Types of shapes
From the toolbar, you can drag-and-drop the shapes onto the diagram. You can see the name of a shape by hovering over it:

| Shape | Description |
|---|---|
| Start event | Acts as a process trigger; indicated by a single narrow border, and can only be Catch, so is shown with an open (outline) icon.
Note: An Event is represented with a circle and denotes something that happens (compared with an activity, which is something that is done). Icons within the circle denote the type of event (e.g., an envelope representing a message, or a clock representing time). Events are also classified as Catching (for example, if catching an incoming message starts a process) or Throwing (such as throwing a completion message when a process ends). |
| Immediate/boundary event | An event that occurs in the middle of the process between activities (represented by a thin double line). For example, a task could flow to an event that throws a message across to another pool, where a subsequent event waits to catch the response before continuing. |
| End event | Represents the result of a process; indicated by a single thick or bold border, and can only Throw, so is shown with a solid icon. |
| Gateway | A gateway is represented with a diamond shape and determines forking and merging of paths, depending on the conditions expressed. |
| Task | A task represents a single unit of work that is not or cannot be broken down to a further level of business process detail. It is referred to as an atomic activity. A task is the lowest level activity illustrated on a process diagram. A set of tasks may represent a high-level procedure. |
| Sub-process | Used to hide or reveal additional levels of business process detail. When collapsed, a sub-process is indicated by a plus sign against the bottom line of the rectangle; when expanded, the rounded rectangle expands to show all flow objects, connecting objects, and artifacts. A sub-process is referred to as a compound activity.
Has its own self-contained start and end events; sequence flows from the parent process must not cross the boundary. |
| Data object reference | Data objects may represent for example documents used in a process, both in physical and digital form. They look like a page with folded top right corner.
They are generally available as long as the process instance is live. |
| Data store reference | To store information in a more permanent way you need Data Stores.
They are commonly used to represent IT systems and applications, but also plain old manila folders or archive would be suitable. You can show how certain steps of a process use the data (either Data Objects or Data Stores) by using a Data Association arrow (dotted line with arrowhead). They are NOT a part of the process flow. |
| Pool / participant | A pool represents major participants in a process, typically separating different organisations. A pool contains one or more lanes (like a real swimming pool). A pool can be open (i.e., showing internal detail) when it is depicted as a large rectangle showing one or more lanes, or collapsed (i.e., hiding internal detail) when it is depicted as an empty rectangle stretching the width or height of the diagram. |
| Group | A Group is a so-called Artifact and represented with a rounded-corner rectangle and dashed lines. The group is used to group different activities but does not affect the flow in the diagram. It is purely a visual element. |
See also: https://en.wikipedia.org/wiki/BusinessProcess_Model_and_Notation#Elements
Shape actions
When a shape is active, it shows its associated possible commands.

| Action | Description |
|---|---|
| Append end event | Adds an end event with a connector after the shape. |
| Append gateway | Adds a gateway with a connector after the shape. |
| Append task | Adds a task with a connector after the shape. |
| Append intermediate/boundary event | Adds an intermediate/boundary event with a connector after the shape. |
| Add text annotation | Adds an annotation to the shape. The annotation line and bounding box can be resized and repositioned. |
| Change element | Allows to set a more specific shape type. |
| Delete | Deletes the shape. |
| Set color | Sets the fill color of the shape. For line objects, the outline is colored. |
| Connect to other element | Adds a connector to an existing shape. It cannot be used if no endpoint for the connection exists. |
Toolbar
From the toolbar, you can drag-and-drop the shapes onto the diagram. You can see the name of a tool by hovering over it:

| Tool | Description |
|---|---|
| Hand tool | When activated, tyou can freely navigate the canvas without accidently moving elements under the cursor. |
| Lasso tool | When activated, you can select multiple shapes at the same time. Objects are only included in the selection if the entire object is part of the selection. Hold the Shift-key to add or remove individal objects.
|
| Create/remove space tool | When activated, you can add or remove space horizontally or vertically.
If the results of the actions are not as intended, you can press |
| Global connect tool | When activated, you can connect a shape with a distant shape. The tool does not stay activated. If you want to use it again, you need to select it again. |
Saving the diagram
All diagrams are saved and maintained in the "Process" namespace.
When your diagram is complete, you can save it. You cannot save if one or more of the following issues exist:
- Not every shape has a label
- The start or end event is missing
To find the issues, click on the linting button at the bottom of the diagram. It will highlight the problems in the diagram. For example, a missing end event can trigger multiple errors:

After correcting the errors, you can save the diagram. The save-dialog will ask if you want to create all description pages. You do not have to do this or you can do this at a later time.
Renaming a shape
To rename the label for a shape, double-click the shape and change the label. If a shape with the same name already exists, the system automatically creates a unique name for the shape by appending a number. When you rename a shape, the associated page is also renamed (if the page already existed previously).
Creating the wiki pages
If you decide to describe your shapes in more detail with individual wiki pages, you need to activate the checkbox in the save dialog:

The next dialog lists all pages that were created:

The colored outlines of the shapes of the diagram now indicate that the shapes are interactive and link to the description pages:

Clicking on any such shape opens its wiki page:

| Element | Functionality | Description |
|---|---|---|
| 1 | Breadcrumb | Shows the location path of the description page (as subpage of the process page). |
| 2 | Incoming connections | Label for the connections that precede this step. |
| 3 | Outgoing connections | Label for the connections that follow this step. |
| 4 | Page flow | Links to the preceding and succeeding description pages. |
| 5 | BPMN task description | Placeholder template that indicates that a custom description can be added below the connections info. To replace the template with a real description, you can simply switch into page editing mode like any other wiki page. If you add content to this page, the placeholder template is no longer needed and you can simply remove it from the page. |
Embedding a process diagram in a wiki page
BPMN diagrams cannot be created on a wiki page itself, but you can embed a diagram by using the related Content droplet.
On any wiki page, open the Content droplets dialog in the visual editor toolbar.
Search for the term "process":

Select the droplet and click Insert. Provide the name of the process and click Save:

If the toggle-switch to show the toolbar is activated, a select menu above the diagram is displayed. It allows to:

- Go to the diagram page: The diagram can only be edited directly in the process namespace.
- Download diagram as SVG: You can save a copy of the diagram locally in SVG-format.
- Center diagram: If you have a large diagram that requires repositioning on the page while viewing it, it can be reset to show the beginning of the diagram from top left again.
- Show raw XML: Switches to the XML source of the diagram.
- Show diagram: Switches back to the diagram after viewing the raw XML.