No edit summary |
No edit summary |
||
| Line 50: | Line 50: | ||
For accessing debugging information, you can follow the guidelines listed at[[mediawikiwiki:Manual:How_to_debug|mediawiki.org/wiki/Manual:How_to_debug.]] | For accessing debugging information, you can follow the guidelines listed at[[mediawikiwiki:Manual:How_to_debug|mediawiki.org/wiki/Manual:How_to_debug.]] | ||
===Error messages in the browser=== | ===Error messages in the browser (DevTools)=== | ||
You can also use the network panel and the JavaScript console in your browser's developer tools to track down possible errors. | You can also use the network panel and the JavaScript console in your browser's developer tools to track down possible errors. | ||
| Line 56: | Line 56: | ||
The following tips apply to Google Chrome. | The following tips apply to Google Chrome. | ||
# '''Press''' <code>F12</code> to open the browser's DevTools . It will open to the side or at the bottom of your browser window. To position | # '''Press''' <code>F12</code> to open the browser's DevTools . It will open to the side or at the bottom of your browser window. To position the pane at the bottom of the window, you can open the customization menu and select the position icon.[[File:devtools positioning.png|alt=Screenshot of DevTools with customization menu highlighted.|center|thumb|550x550px|Positioning the DevTools pane.]] | ||
# '''Switch''' to the ''Network'' panel.[[File:DevTools Network panel.png|alt=Screenshot of Network panel selection|center|thumb| | # '''Switch''' to the ''Network'' panel.[[File:DevTools Network panel.png|alt=Screenshot of Network panel selection|center|thumb|650x650px|Network panel]] | ||
# '''Reload''' the page (<code>F5</code>). The Network log shows all resources that were requested by the page in separate lines. <span style="color: rgb(32, 33, 36); font-family: system-ui, -apple-system, BlinkMacSystemFont, "Segoe UI", Roboto, Oxygen, Ubuntu, Cantarell, "Open Sans", "Helvetica Neue", sans-serif; font-size: 16px; font-style: normal; font-variant-ligatures: normal; font-variant-caps: normal; font-weight: 400; letter-spacing: normal; orphans: 2; text-align: left; text-indent: 0px; text-transform: none; white-space: normal; widows: 2; word-spacing: 0px; -webkit-text-stroke-width: 0px; background-color: rgb(255, 255, 255); text-decoration-thickness: initial; text-decoration-style: initial; text-decoration-color: initial; display: inline !important; float: none;">Every time you click on something, more requests will be logged.</span> | # '''Reload''' the page (<code>F5</code>). The Network log shows all resources that were requested by the page in separate lines. <span style="color: rgb(32, 33, 36); font-family: system-ui, -apple-system, BlinkMacSystemFont, "Segoe UI", Roboto, Oxygen, Ubuntu, Cantarell, "Open Sans", "Helvetica Neue", sans-serif; font-size: 16px; font-style: normal; font-variant-ligatures: normal; font-variant-caps: normal; font-weight: 400; letter-spacing: normal; orphans: 2; text-align: left; text-indent: 0px; text-transform: none; white-space: normal; widows: 2; word-spacing: 0px; -webkit-text-stroke-width: 0px; background-color: rgb(255, 255, 255); text-decoration-thickness: initial; text-decoration-style: initial; text-decoration-color: initial; display: inline !important; float: none;">Every time you click on something, more requests will be logged.</span> | ||
# '''Notice''' any problems that are listed in red.[[File:DevTools.png|alt=Screenshot of network log with an error|center|thumb|650x650px|Errors shown in the network log]] | # '''Notice''' any problems that are listed in red.[[File:DevTools.png|alt=Screenshot of network log with an error|center|thumb|650x650px|Errors shown in the network log]] | ||
# Click on the Name of the resource that shows a problem. Take a screenshot and attach it to your help request.[[File:Dev Tools error 2.png|alt=Screenshot of error details|center|thumb|650x650px|Resource error details]] | |||
==== JavaScript Console ==== | |||
Revision as of 12:20, 20 April 2023
If your wiki is not working as expected, shows a blank page, or if you observe any other errors, you should provide as much of the following information as possible to get the help you need.
Reporting format
You will get the best response if you send your help request with the following information (copy and paste into your form, e.g. on SourceForge or via the ERM Ticket system):
Software versions:
Copy and paste the entire information from the table "Installed Software" from your wiki page "Special:Version" if you have access to that page.

Bug description
A clear and concise description of what the bug is.
To Reproduce
Steps taken before the error happened
Expected behavior
A clear and concise description of what you expected to happen.
Priority
P1- The wiki does not work at all
P2- Some core functionality of the wiki does not work; many users are affected
P3- All other
Error messages
Information in server logs, browser error messages (Developer tools),
Screenshots
Add screenshots if possible
OS/Browser
Operating system and version:
Browser and version:
Error messages
With server access
If you are a wiki administrator with access to your wiki server, you should provide the following info:
List the variables in LocalSettings.php
Please make sure to not provide any sensitive information, such as login information contained in this file. For more info, see mediawiki.org/wiki/Manual:LocalSettings.php.
Send your debug logs
For accessing debugging information, you can follow the guidelines listed atmediawiki.org/wiki/Manual:How_to_debug.
Error messages in the browser (DevTools)
You can also use the network panel and the JavaScript console in your browser's developer tools to track down possible errors.
Network panel error tracking
The following tips apply to Google Chrome.
- Press
F12to open the browser's DevTools . It will open to the side or at the bottom of your browser window. To position the pane at the bottom of the window, you can open the customization menu and select the position icon.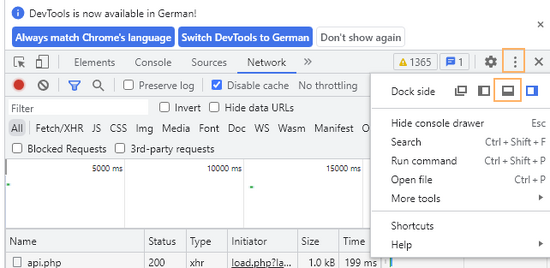
Positioning the DevTools pane. - Switch to the Network panel.
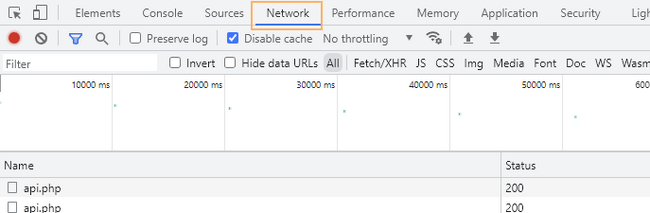
Network panel - Reload the page (
F5). The Network log shows all resources that were requested by the page in separate lines. Every time you click on something, more requests will be logged. - Notice any problems that are listed in red.
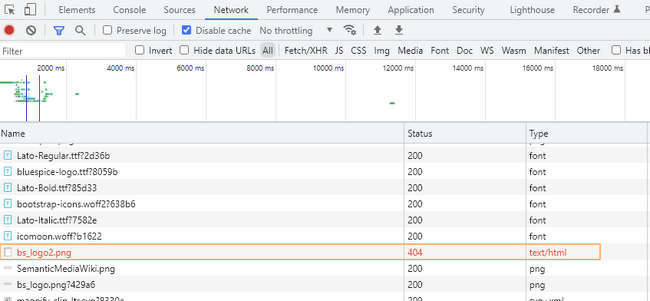
Errors shown in the network log - Click on the Name of the resource that shows a problem. Take a screenshot and attach it to your help request.
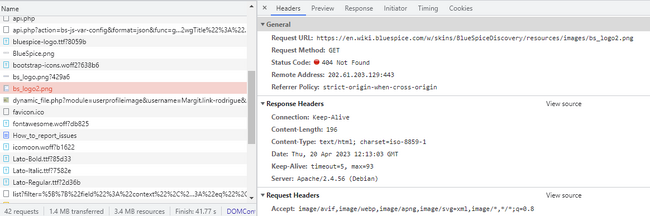
Resource error details


